기사입력 2024.12.03 09:41
.jpeg)
.jpg)
세계적인 임베디드 개발용 소프트웨어 및 서비스 공급회사인 IAR이 Arm용 IAR 임베디드 워크벤치(IAR Embedded Workbench for Arm)의 최신 버전인 9.50.3 기능안전(Functional Safety) 에디션을 발표했다.
2024-02-21 오후 2:39:10by 배종인 기자
세계적인 임베디드 개발용 소프트웨어 및 서비스 공급회사인 IAR이 ㈜디오이즈, ST마이크로일렉트로닉스, 슈어소프트테크㈜, TUV SUD코리아와 함께 기능 안전 강화를 위한 컨소시엄 FSG(Functional Safety Group)를 구성했다.
2024-03-07 오후 2:22:41by 배종인 기자
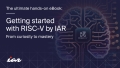
세계적인 임베디드 개발용 소프트웨어 및 서비스 공급회사인 IAR이 르네사스(Renesas)가 자체 개발한 CPU 코어를 탑재한 최초의 범용 32비트 RISC-V MCU를 지원하는 자사의 프리미엄 개발 환경에 대한 기능 강화판을 발표했다.
2024-04-05 오전 11:14:09by 배종인 기자

세계적인 임베디드 개발용 소프트웨어 및 서비스 공급회사인 IAR이 RISC-V V3.30.2용 IAR 임베디드 워크벤치를 위한 C-STAT 정적 분석 도구의 TUV SUD 인증 기능 안전 에디션(Functional Safety Edition)을 출시하며, 코드 품질 자동화를 가속한다.
2024-07-03 오전 11:52:32by 배종인 기자
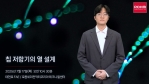
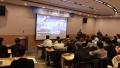
[편집자주] 산업과 제품 전반에 ST MCU의 사용이 보편화되고 있다. 특히 STM32 제품은 현재 3,000여개가 넘어가며 작년에만 600여개 제품이 출시됐다. 생태계와 개발자 커뮤니티를 강조하는 ST마이크일렉트로닉스는 최근 STM32 Summit on Tour Korea(이하 STM32 서밋)를 개최해 파트너사 및 개발자 세션, STM32 최신 솔루션 발표 등을 진행했다. 온디바이스 AI의 유행과 차세대 기술의 구현, 기능 안전과 사이버 시큐리티 신뢰성 확보 등이 화두가 되고 있는 가운데 STM32 서밋의 주요 아젠다들을 살펴봤다. 이영후 IAR 기술지원 매니저를 만나 이번 STM32 Summit on Tour Korea에 참가한 소감과 발표 내용에 대해 이야기를 나눴다.
2024-09-06 오후 3:57:41by 권신혁 기자
MISRA-C:2023에서 변화된 규칙과 사용자들이 유의해야 할 점에 대해 IAR SYSTEMS JAPAN의 Hiroki Akaboshi FAE가 이야기 한다.
2024-10-18 오후 3:38:37by 편집부
.jpg)
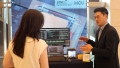
세계적인 임베디드 개발용 소프트웨어 및 서비스 공급회사인 IAR이 자동차, 산업자동화, 의료, 가전 등 다양한 산업에서 요구되는 효율적인 기능 안전 인증을 위한 원스톱 솔루션을 제시했다.
2024-11-18 오전 11:58:25by 배종인 기자

[열린보도원칙] 당 매체는 독자와 취재원 등 뉴스이용자의 권리 보장을 위해 반론이나 정정보도, 추후보도를 요청할 수 있는 창구를 열어두고 있음을 알려드립니다.
고충처리인 장은성 070-4699-5321 , news@e4ds.com