

MathWorks Expands Risk and Investment Management Capabilities with New Framework
 Published2020.11.13 12:18
Evaluate dance-type investment strategies
MathWorks announced today a new backtesting framework for its Financial Toolbox, which will allow investment managers, risk managers, and traders to better utilize the toolbox for risk, investment, and portfolio management.
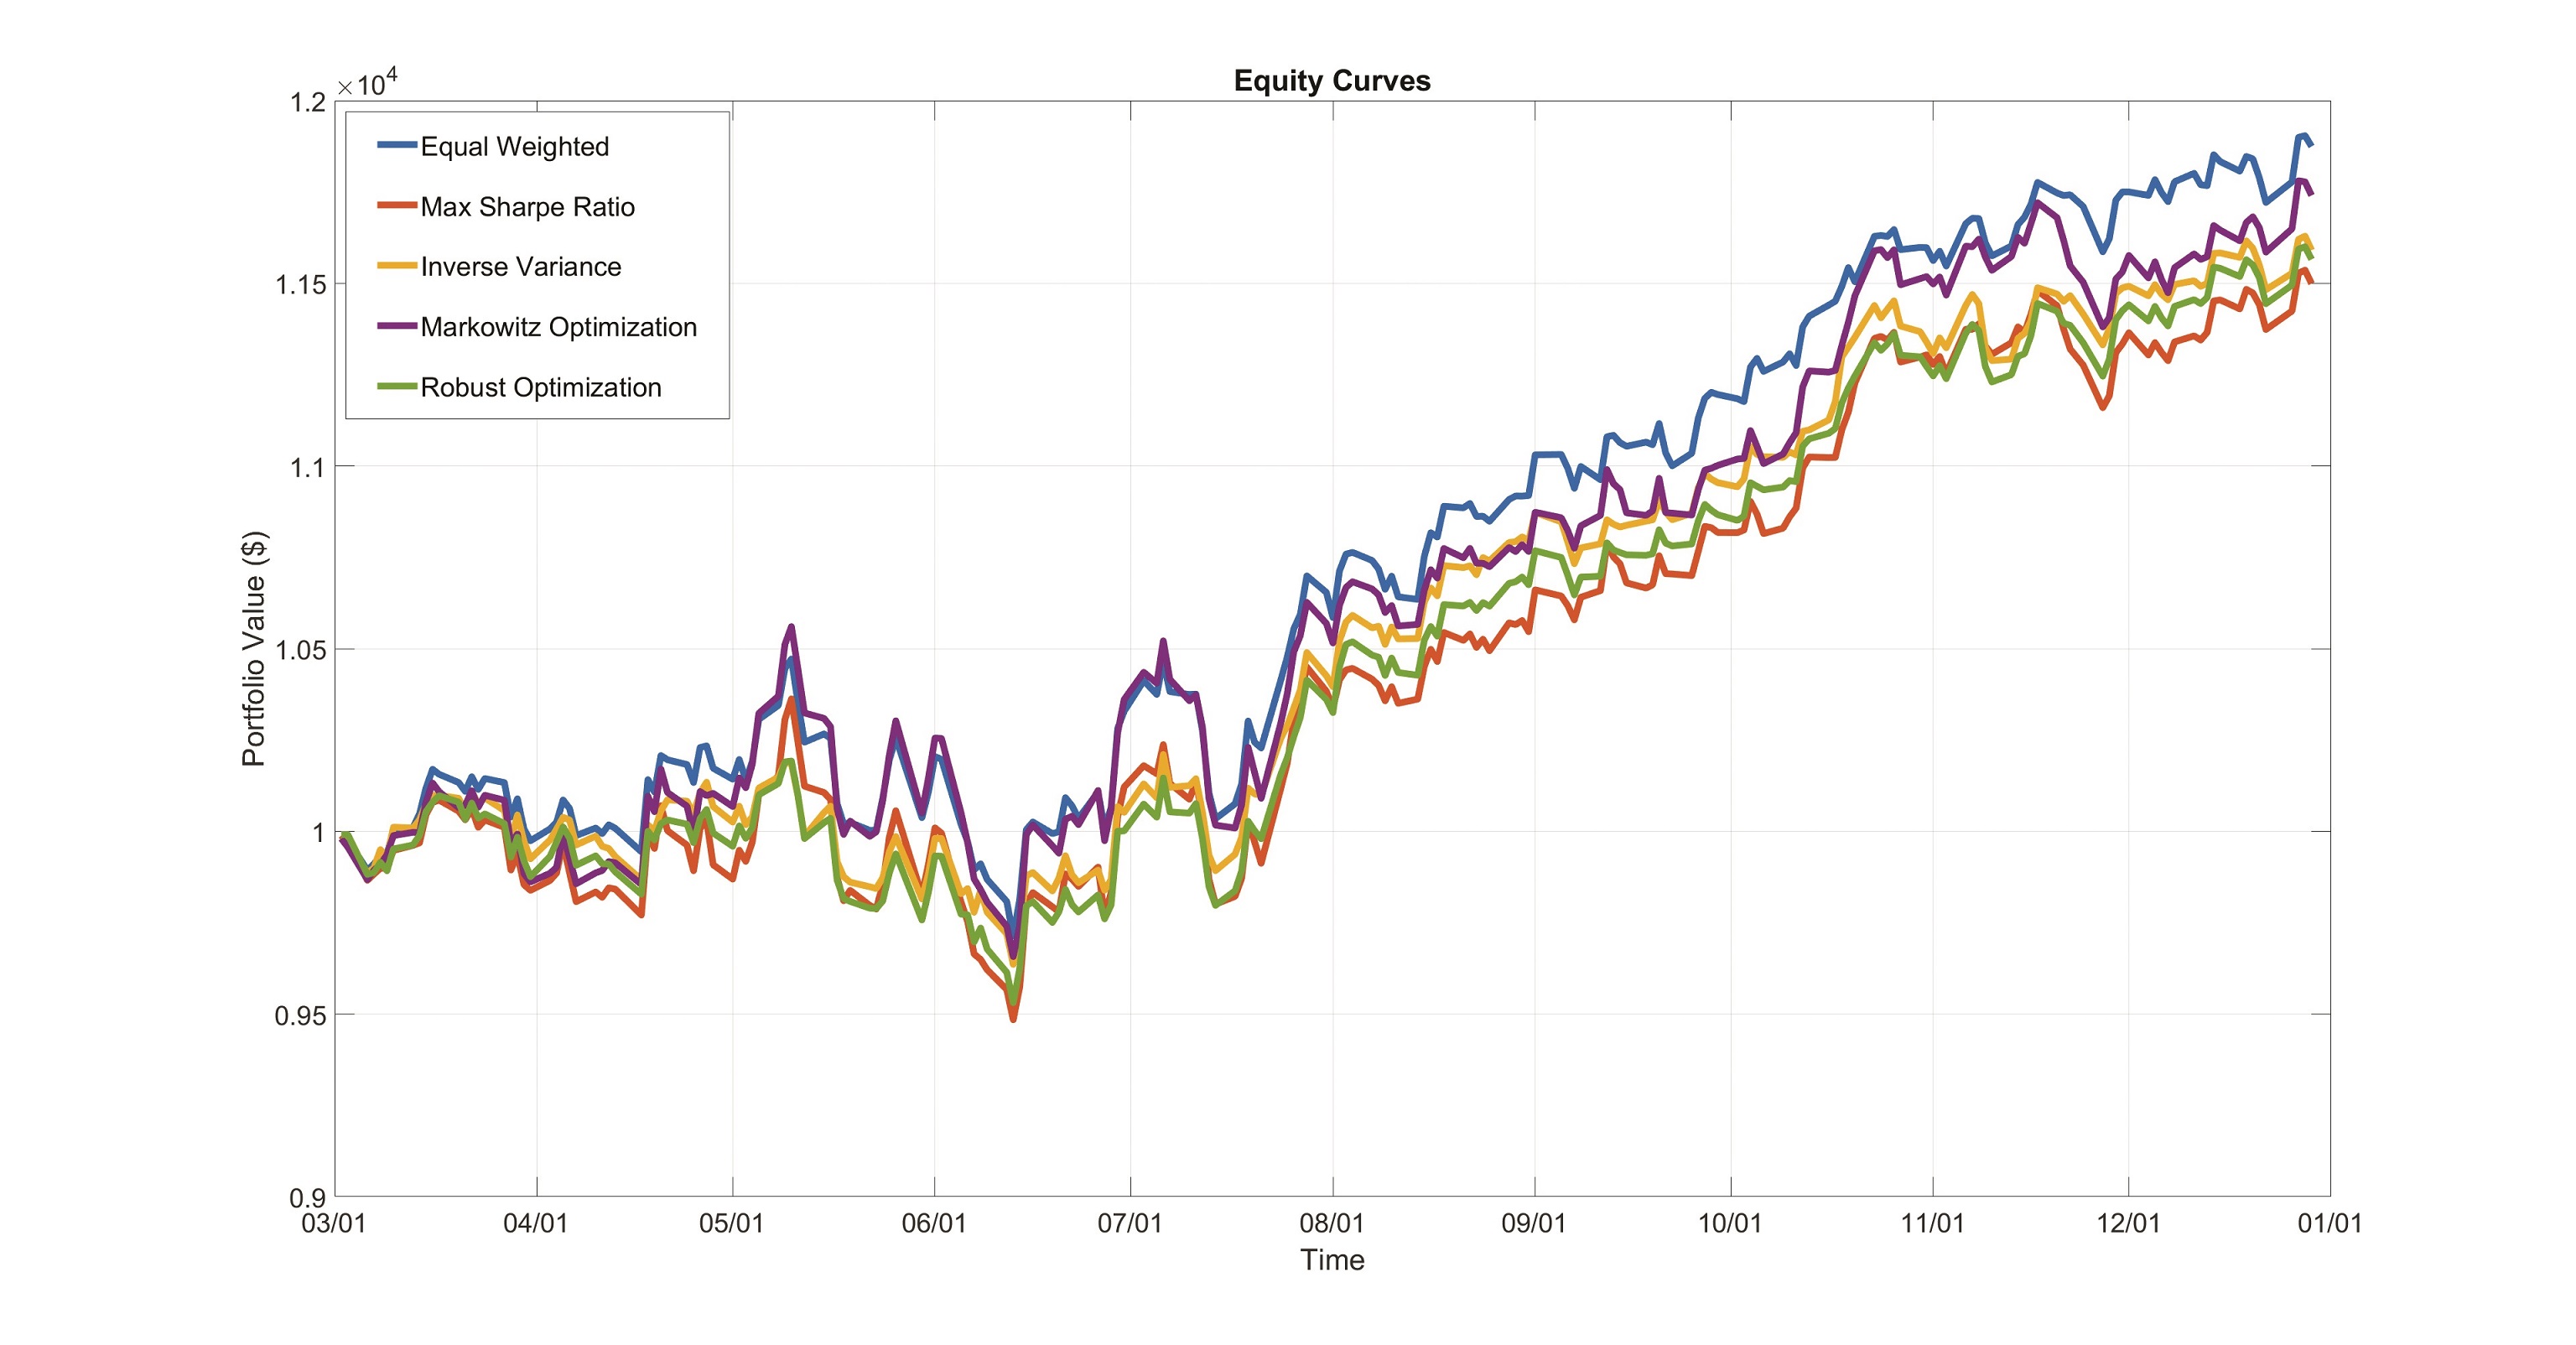
▲ Equity curve from Financial Toolbox that compares backtesting results for various investment strategies [Photo = MathWorks]
The framework can analyze results and generate performance metrics for strategies derived from historical or simulated market data. The toolbox supports custom transaction costs, extended or rolling lookback windows, margin trading, and long/short portfolios.
The Financial Toolbox provides functions for mathematically modeling and statistically analyzing financial data. You can analyze, backtest, and optimize investment portfolios by considering deposit turnover, transaction costs, semi-continuous constraints, and defined minimum or maximum asset counts. Financial professionals use it to estimate risk, model credit scores, analyze yield curves, fixed income instruments and European options, and measure investment performance.
“The Financial Toolbox enables investment managers, risk managers, and traders to evaluate investment strategies across all asset classes and all data sources, including alternative data sets, while continuing to work in a familiar, fully transparent, yet customizable MATLAB environment,” said Stuart Kozzola, Financial Product Line Manager.
Comments
Related news

SK Telecom Launches Jump VR Avatar Mobile Service
SK Telecom has launched a VR-based community service mobile service called Virtual Social World. Virtual Social World incorporates the T Real platform, avatar framework, telepresence, and photorealistic rendering technology, and can be enjoyed on smartphones without wearing an HMD.
2020.03.22by 최인영 기자
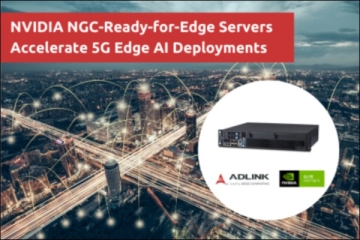
The first 'NGC-Ready' verified OTII-compatible edge server is now available.
On the 8th, ADLINK Technology's edge server MECS-7210 passed validation for 'NGC (Nvidia GPU Cloud)-Ready'. The MECS-7210, which includes two 'Tesla V100 Tensor Core GPUs', underwent functionality and performance testing that facilitates building AI frameworks for machine learning and deep learning.
2020.10.08by 김동우 기자
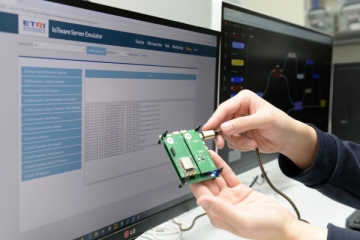
ETRI Unveils Software Development Support Program for IoT Devices
The Electronics and Telecommunications Research Institute (ETRI) has constructed and publicly released a software (SW) development environment that enables easy and convenient creation of IoT devices. ETRI is disclosing core SW frameworks for manufacturing IoT devices and advancing their dissemination by facilitating the facile production of device software. This SW framework provides five types of lightweight operating systems (OS), firmware for sensors and communications, and modules for resource management and low-power management. Therefore, all developers can create and connect microservices to easily complete programs. Additionally, experts can reduce the effort of inputting hundreds to thousands of lines by retrieving necessary programs and modifying only certain tasks.
2020.10.19by 김동우 기자
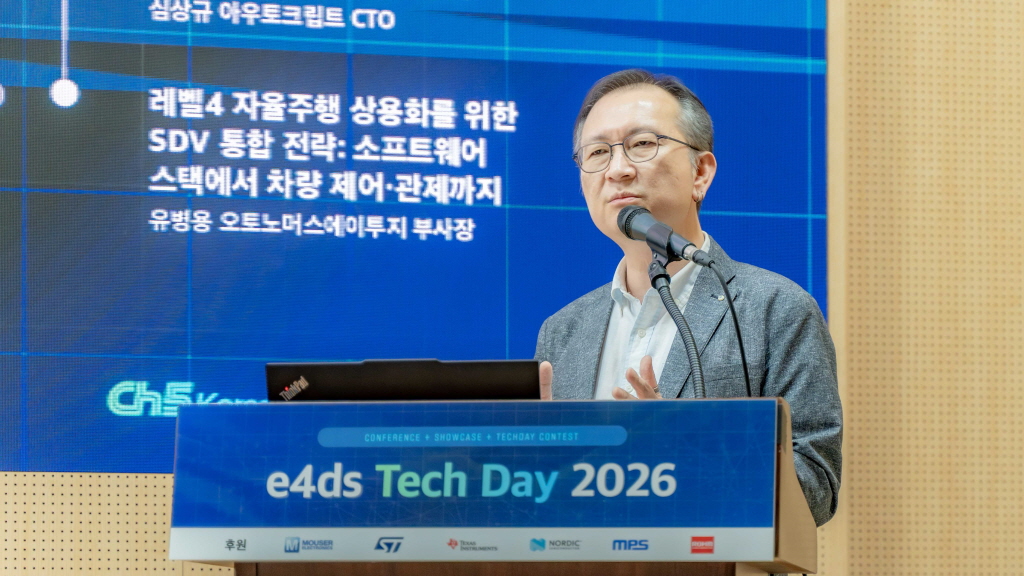
[e4ds Tech Day 2026 ⑨] Sim Sang-gyu, Autocrypt CTO: "In the Physical AI Era, Automotive Security Must Extend Beyond the Vehicle"
At e4ds Tech Day 2026, Sim Sang-gyu, CTO of Autocrypt, explained automotive cybersecurity strategies in the era of Physical AI and SDV (Software-Defined Vehicle). Automobiles are evolving as part of an ecosystem connected to AI, cloud, chargers, IoT, and robots, and he emphasized that the scope of security must expand beyond the vehicle interior to the entire connected environment. In particular, AI model tampering, adversarial attacks, OTA updates, and EV charger hacking were identified as major threats. He explained that response measures require zero trust, AI model integrity protection, intrusion detection, Security by Design and Default, and full lifecycle security management, and that proactive security system establishment beyond regulatory compliance is critical for securing future mobility competitiveness.
2026.10.12by 배종인 기자
NVIDIA to Invest $1 Billion in U.S. Science Over Next Five Years
NVIDIA has announced plans to invest $1 billion over the next five years to strengthen U.S. scientific and technological competitiveness. The company will enhance cutting-edge artificial intelligence research and development capabilities in key areas including quantum computing, healthcare, and energy security, while expanding support for higher education research institutions and cloud service providers. NVIDIA is participating as a major industry partner in the White House Office of Science and Technology Policy's Genesis Mission, and is promoting supercomputer construction in collaboration with national laboratories including Argonne and Los Alamos.
2026.10.12by 배종인 기자