

IAR sets new standards for debugging with innovative C-SPY debugger
 Published2024.12.03 09:41
.jpeg)
IAR, a global provider of embedded development software and services, has set a new standard for debugging with its innovative C-SPY debugger for Visual Studio Code.
IAR recently announced the latest update to the IAR Debug Extension for Visual Studio Code.
This update sets a new standard for embedded device debugging with the IAR C-SPY debugger combined with the IAR Listwindow technique.
This update gives developers access to real-time data visualization and processing capabilities.
In particular, the IAR Listwindow technique speeds up debugging through array and data structure analysis, providing an efficient coding tool for embedded system developers.
Key features include advanced Listwindow techniques, full breakpoint access, and flexible debug launch strategies.
These features help developers clearly analyze code behavior and simplify the troubleshooting process.
In particular, the debugging capabilities of IAR C-SPY and the integration with Visual Studio Code provide powerful features and ensure high-quality results for developers.
Anders Holmberg, IAR’s chief technology officer, said, “Visual Studio “Using IAR’s C-SPY extensions in their code gives developers access to advanced debugging features within a trusted tool. This update significantly improves the visualization of debug information, making it easier to troubleshoot complex problems in real time,” he said.
This new debugging tool will help developers and teams focus on developing innovative technologies by making debugging, which takes up a significant portion of development time, more efficient. IAR's new extensions can be found at iar.com/vscode.

Comments
Related news
.jpg)
IAR Releases Latest Functional Safety Version of IAR Embedded Workbench for Arm
IAR, a globally recognized software and services supplier for embedded development, has announced version 9.50.3 Functional Safety Edition of IAR Embedded Workbench for Arm.
2024.02.21by 배종인 기자
IAR Leads Embedded Functional Safety Certification Support and Product Development Capabilities
IAR, a global software and services provider for embedded development, has established a Functional Safety Group (FSG) consortium together with Dioiz Co., Ltd., STMicroelectronics, SureSoftTech Co., Ltd., and TÜV SÜD Korea to strengthen functional safety.
2024.03.07by 배종인 기자
IAR Supports Renesas RISC-V MCUs
IAR, a global provider of software and services for embedded development, has announced an enhanced version of its premium development environment that supports Renesas's first general-purpose 32-bit RISC-V MCU equipped with a self-developed CPU core.
2024.04.05by 배종인 기자

IAR, Accelerates Automation of Embedded SW Code Quality
IAR, a global provider of embedded development software and services, releases the TÜV SÜD certified C-STAT static analysis tool Functional Safety Edition for IAR Embedded Workbench for RISC-V V3.30.2, accelerating code quality automation.
2024.07.03by 배종인 기자
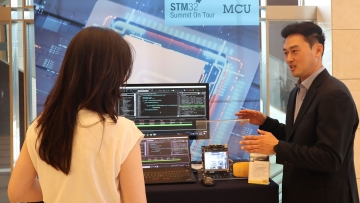
[STM32 Summit] Young-Hoo Lee, IAR Manager, “Applying Functional Safety SW Package Optimized for ST”
[Editor's Note] The use of ST MCUs across industries and products is becoming increasingly common. In particular, the STM32 product lineup has exceeded 3,000 variants, with over 600 new products launched last year alone. ST Microelectronics, which emphasizes ecosystem and developer community, recently held the STM32 Summit on Tour Korea, featuring partner and developer sessions as well as presentations on the latest STM32 solutions. Against the backdrop of on-device AI trends, implementation of next-generation technologies, and ensuring reliability in functional safety and cybersecurity, we examined the key agendas of the STM32 Summit. We met with Lee Young-hoo, IAR Technical Support Manager, to discuss his impressions of participating in this STM32 Summit on Tour Korea and the details of his presentation.
2024.09.06by 권신혁 기자