


Understanding PSU dynamic control behavior using Bode plots
 Published2021.09.14 16:14
Control loop speed and regulation stability are identifiable.
Representative tools of ADI include 'LTpowerCAD' and 'LTspice'.
One tool that can be used to quickly assess whether a designed power supply unit (PSU) meets the requirements for dynamic control behavior is the 'Bode plot'.
Power supplies typically maintain a fixed output voltage through a control loop. This control loop can be stable or unstable. Furthermore, the control loop can be adjusted quickly or slowly. Control loops can often be described using Bode plots.
Bode plots give you an immediate indication of how fast or slow a control loop is, and especially how stable its regulation is.
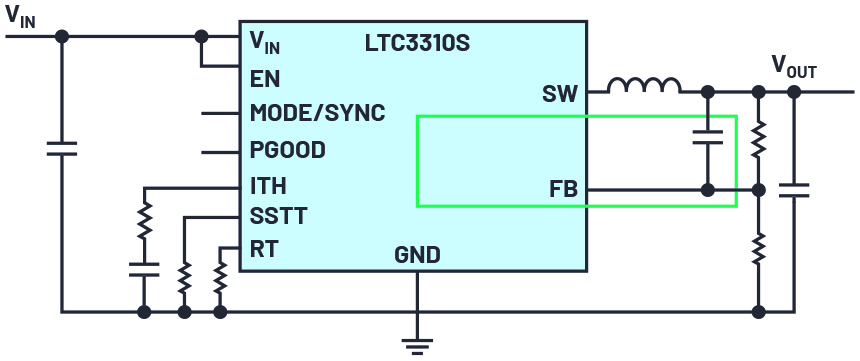
Buck topology switching regulator with adjustable voltage [Figure 1 = ADI]
The regulator above converts a high input voltage to a low output voltage. The goal is to regulate the output voltage VOUT as precisely as possible. For this purpose, a control loop is integrated into the circuit via a feedback (FB) pin, which detects voltage changes at VOUT.
The control loop must respond quickly to ensure that VOUT is always readjusted as accurately as possible. The output voltage must be readjusted whenever the input voltage or load current changes.
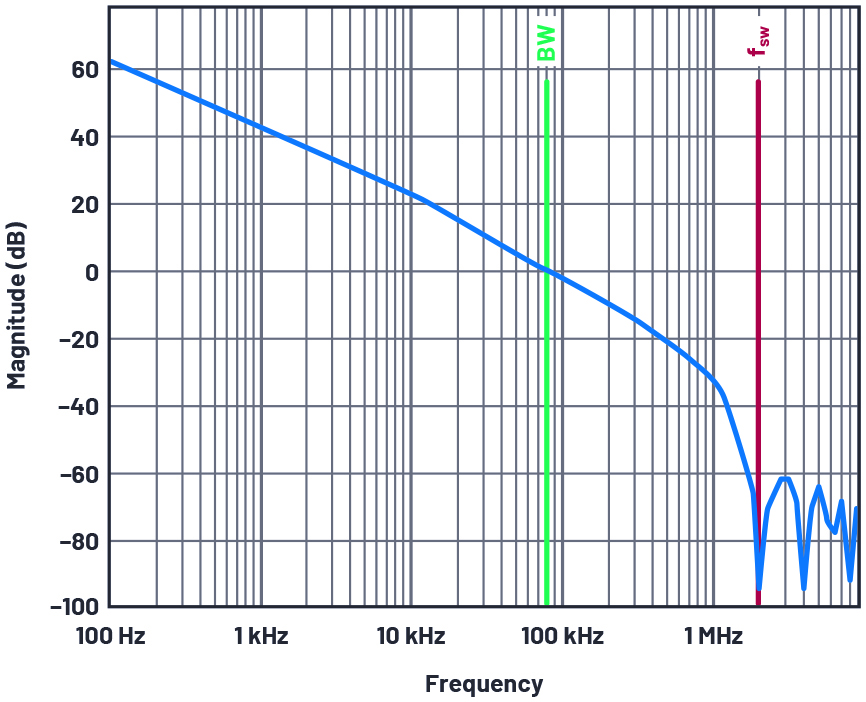
There is a 0dB crossover point at about 80kHz [Figure 2=ADI]
The above is a control loop gain curve in a Bode plot. This curve provides two important pieces of information: It can be read at the frequency where the gain is 1, or 0 dB.
In the control loop shown above, the so-called crossover frequency occurs at approximately 80 kHz. This frequency must not exceed 1/10th of the switching frequency set in the switch-mode power supply. Failure to do so can result in unstable operation.
The second piece of information is the area under the gain curve, i.e. the integral of the function. The higher the DC gain and crossover frequency, the better the control loop maintains the output voltage at a constant level.
.jpg)
The above is a phase curve from a Bode plot. The most important value read from this plot is the phase margin, which indicates the stability of the control loop. The phase margin can be read from the crossover frequency obtained from the gain plot. See [Figure 2].
In this example, the crossover point is at 80 kHz. Therefore, the phase margin in [Figure 3] is approximately 60°. A phase margin less than approximately 40° is considered unstable.
The control loop is optimally configured when the phase margin is between 40° and 70°. Within this range, a reasonable compromise exists between fast regulation and excellent stability. When the phase margin is greater than 70°, the system is very stable, but regulation tends to be extremely slow.
Typically, Bode plots are not provided in switching regulator data sheets because they are too dependent on the circuit design. Each operating condition, such as input voltage, output voltage, and load current, as well as the switching frequency used and the selection of external components such as inductors and output capacitors, can have a significant impact.
For this reason, Bode plots are often generated using computational tools such as LTpowerCAD® or simulation tools such as LTspice® . These tools can quickly verify that the planned circuit meets the requirements for dynamic control behavior.
This article is a summary of the article titled "Power Supply Design: How Bode Plots Can Help You Meet the Requirements for Dynamic Control Behavior" by Frederik Dostal, FAE, Analog Devices (ADI), Munich, Germany.
Comments
Related news
ADI to Supply 16-bit Precision, High-Speed DAQ Micromodules
Analog Devices (ADI) announced the launch of 'ADAQ23875', a 16-bit, 15MSPS micromodule (μModule) data acquisition solution that digitizes high-speed transient signals in power analysis applications and implements low-latency digital control loops in hardware-in-the-loop (HiL) or source measurement unit applications.
2021.05.27by 강정규 기자
Microchip Launches Aerospace-Qualified Baseless Power Module
Pneumatic and hydraulic systems in aircraft are being replaced with electrical systems to reduce carbon emissions. Implementing next-generation aircraft electrical systems requires new power conversion technologies. In response, Microchip has launched aerospace-certified baseless power modules in collaboration with the Clean Sky industrial consortium to support high-efficiency, lightweight, and compact power conversion and motor drive systems.
2021.08.04by 강정규 기자

Maxim Launches Two Multiphase Power Chipsets for AI Computing
Large-scale data center designers are grappling with how to address peak power and thermal increases as demand for AI applications and deep learning surges. Maxim Integrated has launched the MAX16602 AI Core Dual Output Voltage Regulator and MAX20790 Smart Power Stage IC to enable high-performance, high-power AI system designers to implement solutions that reduce power costs and heat generation.
2021.08.19by 강정규 기자

Intel Unveils Next-Generation 'Core Ultra Series 3' and vPro Platform for Enterprise PCs
Intel has officially unveiled the "Intel Core Ultra Series 3" for next-generation enterprise PCs and the latest vPro platform, addressing a wide range of demands from enterprise notebooks to high-performance workstations.
2026.03.26by 배종인 기자
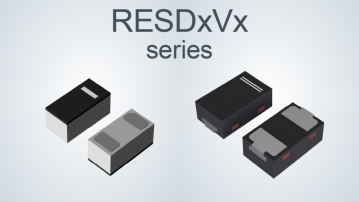
ROHM Launches ESD Protection Diode Compatible with High-Speed Interfaces of 10Gbps or Higher
Semiconductor specialist ROHM has developed the 'RESDxVx series' of ESD (electrostatic discharge) protection diodes capable of responding to next-generation high-speed data communication environments exceeding 10Gbps, simultaneously enhancing both signal quality maintenance required in high-speed interfaces and IC protection performance.
2026.03.26by 배종인 기자