

[Contribution] Designing a flexible and affordable blood glucose meter using an 8-bit MCU
 Published2016.01.29 10:30
Microchip Technology
About 8.5% of the world's population suffers from diabetes, making it the eighth leading cause of death. The World Health Organization (WHO) estimates that diabetes will become the seventh leading cause of death by 2030. This increasing trend is evidenced by recent statistics showing that in 2000, there were about 1 million deaths due to diabetes, but in 2011, there were 1.4 million.
One of the main ways to manage diabetes is to keep blood sugar levels as close to normal as possible, which has led to the increased use of blood glucose meters. Blood glucose meters are medical devices used to measure blood glucose levels. Blood sugar levels are measured in milligrams per deciliter (mg/dl) or millimoles per liter (mmol/l). Blood glucose meters have become an essential part of home blood sugar monitoring devices used by people with diabetes. These measurements can be made several times a day.

<Capture from Microchip homepage>
Blood glucose meters are usually based on electrochemical technology and use electrochemical test strips to perform the measurement. A small amount of blood to be tested is dropped onto a disposable test strip used to measure blood glucose in the blood glucose meter. The two most common methods used for electrochemical measurement of blood glucose are colorimetric and amperometric.
In colorimetric methods, sensors such as LEDs or light sensors form the analog interface. Transimpedance amplifiers are used to measure blood glucose concentration. The principle of color reflection is applied to determine the color intensity in the reaction layer of the test strip by photometry. The meter calculates the amount of blood glucose concentration as a numerical value.
In the amperometric method, a capillary is used to draw blood from one end of the test strip. The test strip also contains an enzyme electrode containing a reagent such as glucose oxidase. Glucose undergoes a chemical reaction in the presence of the enzyme, and electrons are generated during the chemical reaction. The charge passing through the electrode is measured, which is proportional to the blood glucose concentration. Ambient temperature measurements are also made to compensate for the effect of temperature on the reaction rate. This method is used in most blood glucose meters, and Figure 1 shows how the test strip works.
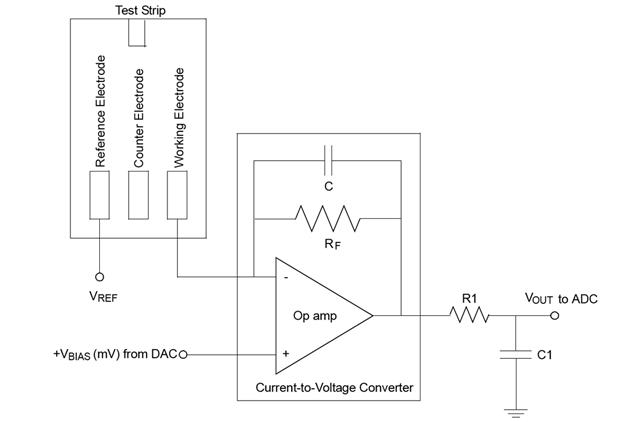
Figure 1 : How a blood glucose meter test strip works
The test strip forms the main biochemical sensor on which the blood sample is placed and has three electrodes. Electrons are produced at the working electrode during a chemical reaction. This electrode is connected to a current-voltage amplifier. The reference electrode is maintained at a constant voltage relative to the working electrode to induce the desired chemical reaction. The third is the counter electrode, which supplies current to the working electrode. Most glucometer designs use only the reference and working electrodes.
An accurate reference voltage (Vref) must be applied to the reference electrode, and an accurate bias voltage (Vbias) must be applied to the operational amplifier. This method maintains a precise potential difference between the working and reference electrodes. This voltage is the stimulus that drives the output current of the test strip, the magnitude of which is used to count the number of electrons.
When a blood sample is placed on the test strip, a reaction of glucose with enzymes occurs. Electrons are produced during the chemical reaction. The flow of electrons corresponds to the flow of current through the working and reference electrodes. This current varies with the blood glucose concentration. The current is measured using a transimpedance amplifier (current-to-voltage converter) and an analog-to-digital converter (ADC). The output of the transimpedance amplifier can be seen as a change in voltage depending on the change in blood glucose concentration.
Digital implementation
As shown in Figure 2, the digital implementation of the blood glucose meter can be achieved using the Microchip 8-bit PIC16LF178x. Known for its ultra-low power operation, the PIC device incorporates two op-amps, two 8-bit digital-to-analog converters (DACs), a single analog-to-digital converter (ADC) with up to 11 channels, built-in EEPROM, I2C, and a 16-bit timer.
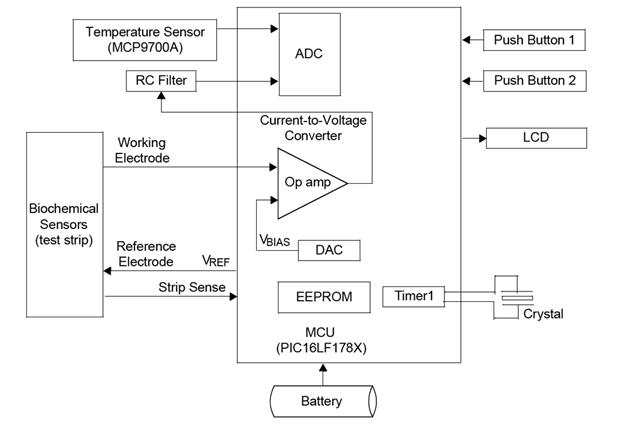
Figure 2 : Blood Glucose Meter Block Diagram
When a blood sample is placed on a test strip, the blood sugar undergoes a chemical reaction, generating electrons. The flow of electrons (current flowing through the working electrode) can be measured. This current varies with blood sugar concentration. The current can be measured with the help of a current-to-voltage converter using the internal op-amp and high-frequency signal filtering of the PIC device. The filtered signal is sent to a 12-bit ADC module.
The PIC device starts capturing the voltage of the ADC channel about 1.5 s after placing the blood sample. Approximately 2048 ADC measurement results are obtained. Their average value is substituted into the regression equation Y=mX+C, where Y is the blood glucose concentration (mg/dl), m is the slope, X is the average ADC measurement of the op-amp output voltage, and C is a constant.
Blood glucose concentration can be determined using the regression equation and the value displayed on the LCD in mg/dl or mmol/l. Up to 32 blood glucose measurement values can be stored in the built-in EEPROM and can be checked later on the LCD. The power of the blood glucose meter demo board is supplied by the onboard lithium battery (3V, 225mAH, CR2032). The time to start capturing ADC values (1~1.5s) and the number of ADC measurements obtained should be modified to match the type and characteristics of the test strip used.
Hardware Design
The design specifications for these blood glucose meters require a blood glucose concentration measurement range of 20 to 600 mg/dl, corresponding to 1 to 33 mmol/l. Test results should be displayed within 5 seconds, and the most recent 32 blood glucose measurements should be automatically stored with a date and time stamp. The general regression equation is implemented and modified according to the characteristics of the test strip, so there is no need for test strip coding.
The single board uses 28-pin PIC16LF178x devices. An In-Circuit Serial Programming (ICSP™) connection was used for debugging and programming.
The LCD not only displays the measurement values in mg/dl and mmol/l, but also displays guidance messages such as “Insert test strip”, “Strip inserted, add sample”, and “Faulty test strip”.
The sensor is needed to detect when a test strip is inserted, measure the temperature, or check the battery status. There are two push buttons, one to read previously stored data and one to set the date and time.
Firmware Features
The firmware should sense the test strip current using the built-in op-amp, DAC, and ADC of the PIC device. The ADC readings should be captured after the test strip is inserted and a rise of 450 mV or more is observed. The recording of ADC readings should begin 1.5 s after the test sample is placed on the test strip and the average is calculated. The blood glucose concentration can be calculated using the regression equation and the average ADC readings.
The firmware module enables LCD interface and display routines, op-amp configuration, DAC configuration, storage of blood glucose measurements in onboard EEPROM, ADC channel readings, glucose concentration calculation, and real-time clock/calendar (RTCC) implementation using a timer for timestamping.
composition
The reference voltage of the DAC is connected to the internal fixed reference voltage (FVR) buffer 2 and is set to 2.048 V. The DAC output voltage is set to 400 mV.
The op-amp output (current-voltage converter output) was measured via ADC channel 0. ADC channel 3 is used to measure battery voltage and indicate a low battery condition. The temperature sensor output is connected to ADC channel 8 to measure temperature.
Blood glucose measurement values are stored in the internal EEPROM. When switch S1 is pressed in sleep mode, the PIC device enters memory mode and the stored blood glucose measurement values are displayed on the LCD. To view previous blood glucose measurement values, press switch S3. Pressing switch S1 again exits memory mode.
A 16x2 character LCD is used to display blood glucose levels and text messages. The LCD's VSS is controlled via a port pin of the microcontroller, thereby powering off the LCD during sleep mode.
A timer with an external 32.768 kHz watch crystal is used to implement the RTCC. The current date and time can be set for the RTCC using switches S1 and S3. As shown in Figure 3, the non-inverting input channel of the op-amp is connected to the DAC output, which is set to 400 mV. The inverting terminal of the op-amp is connected to the working electrode. The current-to-voltage converter is configured with the support of external resistors and capacitors. The op-amp output is connected to the ADC channel of the PIC.
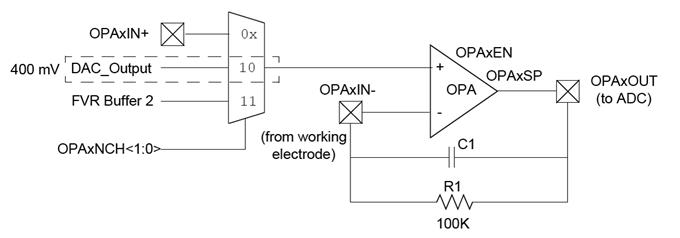
Figure 3 : Op-amp configuration
The current consumption of the blood glucose meter is approximately 1.1 mA in operating mode and 3 μA in sleep mode. The blood glucose meter was in sleep mode approximately 99.5% of the time.
conclusion
Blood glucose measurements are affected by external factors such as temperature, humidity, altitude, etc. This is because the rate of enzyme reaction depends on these and other environmental factors. Also, for test strips made of different chemicals, the given regression equation must be changed using MATLAB or Microsoft Excel. These factors must be taken into account when designing a blood glucose meter with a specific test strip.
The PIC16LF178X MCU has an integrated op-amp, 12-bit ADC, DAC, and EEPROM. This provides a combination suitable for battery-operated application types that require precision measurements and low current consumption. The PIC devices with various advantages can be used to implement flexible and low-cost glucometer designs.

Comments
Related news

[MCU Q&A] 1. What criteria should I apply when selecting an MCU?
MCU Q&A ① Microcontrollers (MCUs) are essential components with diverse applications, ranging from rice cookers in our everyday lives to cutting-edge automobiles. But how much do we really know about MCUs? Do we simply select products based on the basic specifications that match the system we want to use? Or are you curious about how to connect an EEPROM to an MCU, what the differences are between MCUs and DSPs, or what the criteria are for selecting MCU peripherals? Starting today, e4ds News will run a four-part MCU Q&A series. We hope that information you have been curious about or may have overlooked will help you in selecting the right products.
2016.01.18by 신윤오 기자
[Feature] Visiting MCU Companies ⑥ Microchip: “Development Boards Will Be an Excellent Starting Point for IoT Design”
'MCU Ventures' this time introduces Microchip Technology Inc., a traditional MCU leader. Microchip is a global specialist in microcontroller, mixed-signal, analog, and flash IP solutions, offering a variety of customer applications that reduce product development risk, lower total system cost, and enable faster time-to-market. Through an interview with Wayne Freeman, Product Marketing Manager of Microchip's MCU8 division, we take a closer look at the company.
2016.01.25by 신윤오 기자
.jpg)
SalePoint Signs Multi-Year Partnership Agreement with AWS… Promoting Identity Security that Integrates Even AI Agents
Sailpoint has entered into a multi-year strategic partnership agreement with AWS and is moving forward with establishing an integrated governance system that manages both human and non-human identities together. The plan is to consistently manage access permissions in an environment where AI agents are increasing as work execution entities, while applying the principle of least privilege and automated policy enforcement. The two companies plan to jointly expand capabilities to manage the identities of various entities, including AI agents, within a single layer in the AWS environment. This collaboration is interpreted as a move to design security and governance together in corporate environments where AI adoption is expanding.
2026.03.26by 배종인 기자
.png)
Databricks Unveils Open AI Security Monitoring 'Lakewatch'
Databricks entered the security market on March 24 by unveiling LakeWatch, an open-source agentic SIEM. The core functionality of this product is to integrate and analyze security, IT, and business data in a single environment to support AI-based threat detection and investigation. The company explained that it reduces the limitations of existing security operations centers, which have had to forgo some data due to high cost structures, and enables large-scale data analysis and automation based on open formats and ecosystems. LakeWatch is currently offered as a private preview, with Adobe and Dropbox mentioned as early customers. Databricks also announced an expanded partnership with Anthropic as well as the acquisition of Antimatter and SiftD.ai.
2026.03.26by 배종인 기자